Identify is a platform designed to explore and compare patient populations using large-scale healthcare data, helping surface actionable insights for research and planning.
ROLE
Product designer
company
Clint Health
Understading and uncovering healthcare data
Hidden insights within messy data
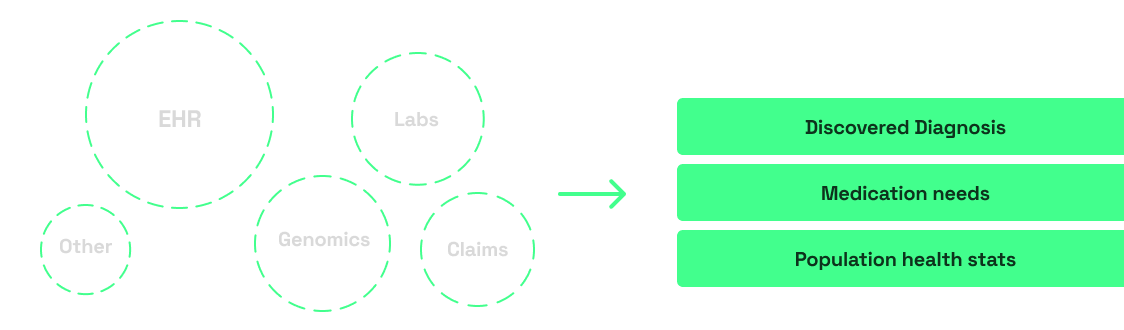
Healthcare data is incredibly rich and full of potential insights, but it is also notoriously messy, fragmented, and difficult to work with. On top of that, strict privacy regulations make accessing and handling this type of data a significant challenge.
Seeing all of this potential, the company started exploring ways to process and model this data into potentially useful insights in many different areas of healthcare, such as, point-of-care solutions, clinical trial planning and recruitment, and research.
The future of healthcare technology?
At the beginning of this project, the adoption of large-scale healthcare data for decision-making was still evolving within the healthcare space, there was a lot of skepticism on how reliable insights from this data might be but also many stakeholders starting to realize that this might be the future of healthcare technology.
Considering this context, our main challenge was to explore ways to display the company’s data capabilities to possible users and stakeholders within the industry in order to define the most fitting use cases for that technology.
Our main goals were:
1
Explore and validate potential use cases of the company’s clinical intelligence capabilities.
2
Serve as a showcase for investors, demonstrating the platform’s analytical power.
3
Establish a foundation for future healthcare data products.
Defining requirements
Research to define focus
Our research phase was intentionally broad and experimental. We gathered input from a variety of stakeholders in different areas of the healthcare space, such as, academic researches, physicians, , nurses, many different positions within the pharmaceutical industry, hospital directors and managers. We were able to draw a broad but rich picture of the needs and opportunities within that space.
Based on these insights, we developed a set of hypotheses around how the product might be used and defined an initial direction for the product:
Focus on one disease area
We chose cardiovascular due to the expertise of one of the founders, a cardiologist.
Enable flexible filtering
Offer different possibilities to explore the dataset.
Design a comparison-based analysis
Compare cohorts and subcohorts.
Finding the starting point
Having a better landscape picture and defined focus, now it was time to bring it all together. This phase was highly collaborative across design, engineering, data science and leadership.
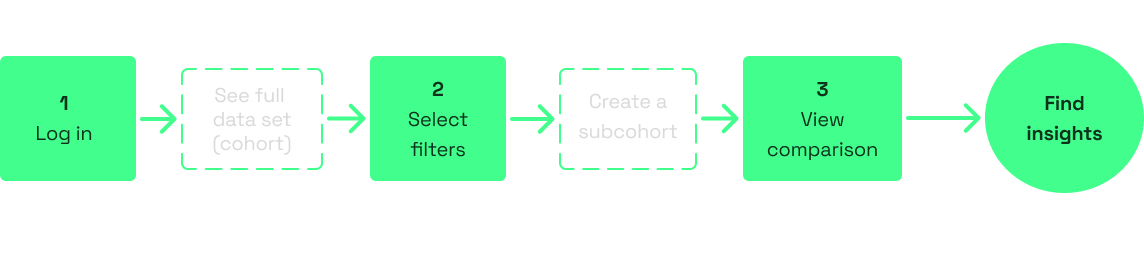
We had several work sessions where the user flows and overall wireframe exploration happened in parallel, helping us rapidly align on a direction despite constraints of resources and data sources. We defined our key user flow:
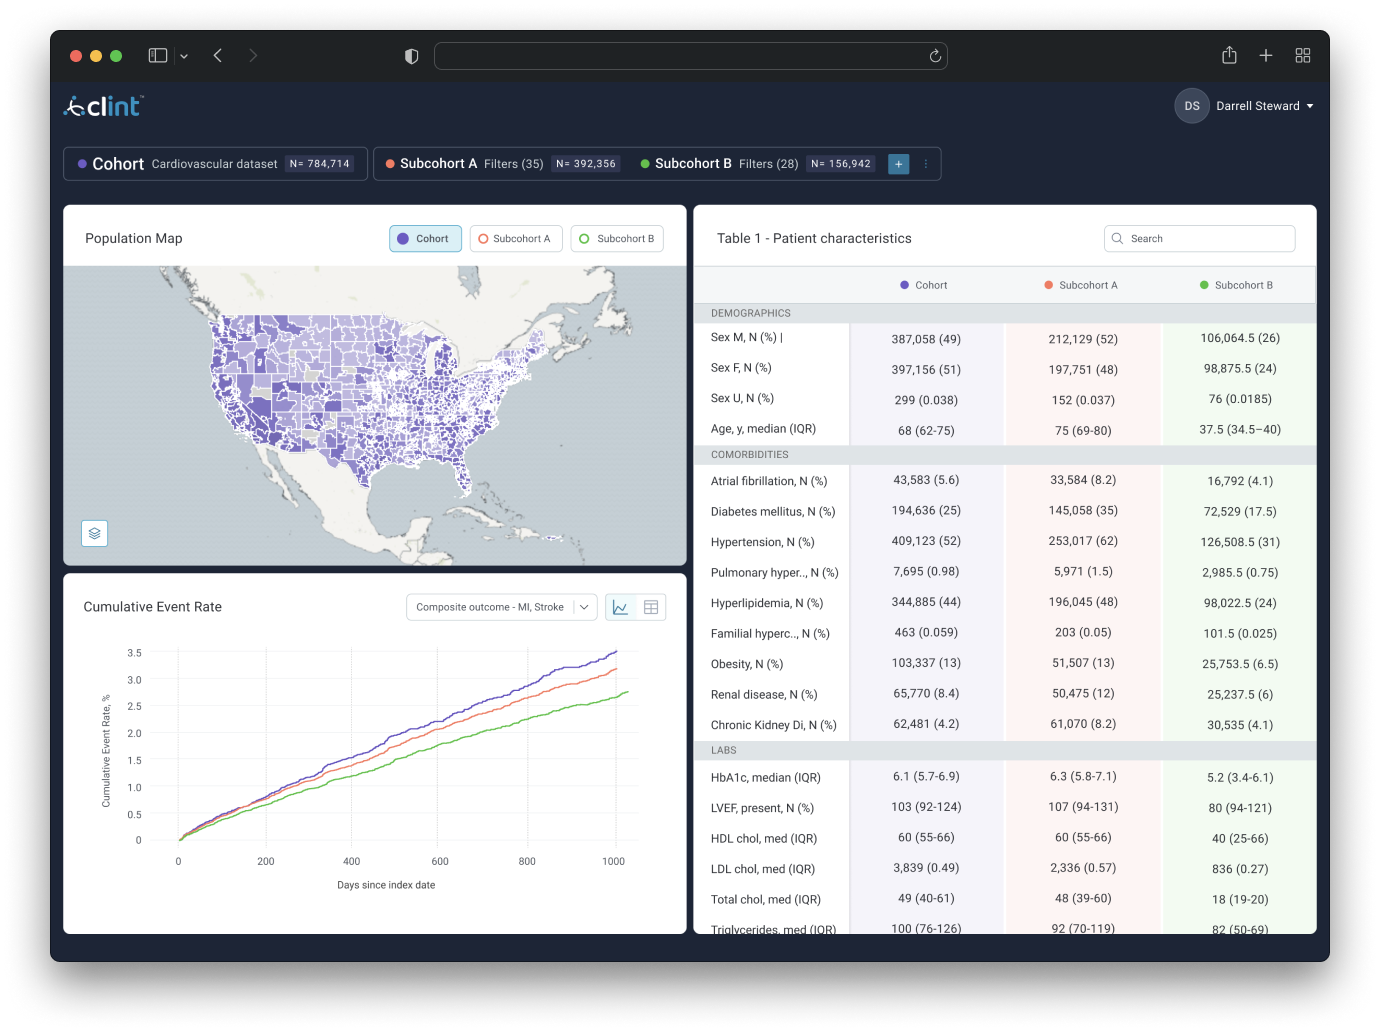
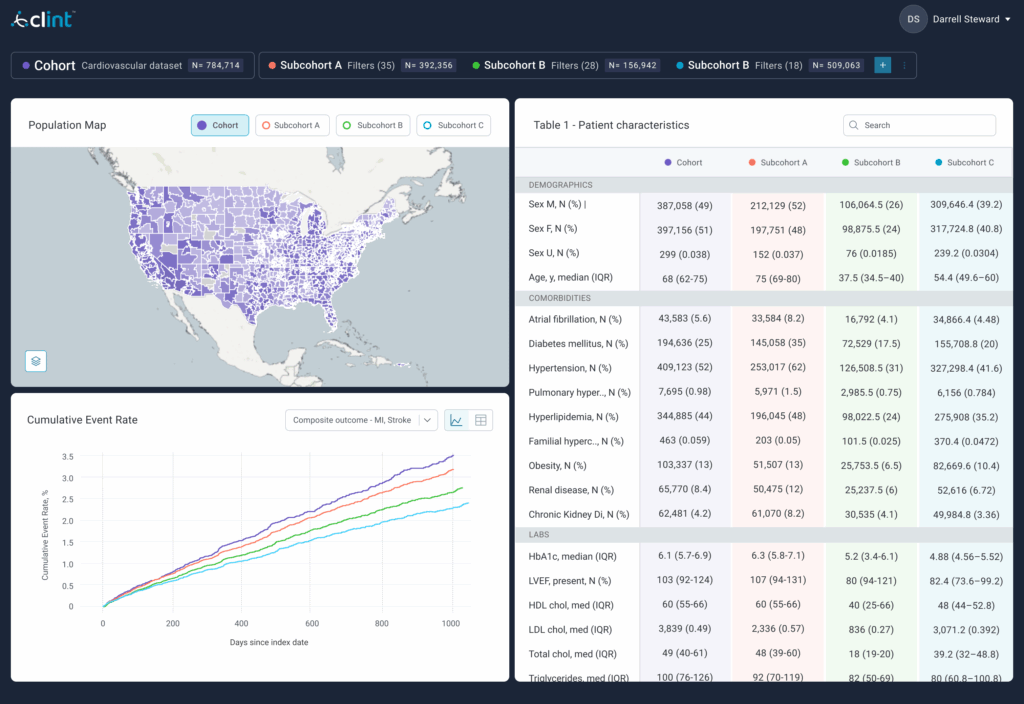
Data visualization
I worked closely with the data science team to determine the best way to visualize the most relevant aspects of dataset for the majority of the possible use cases we gathered from early steps.
Each view had clear use cases:
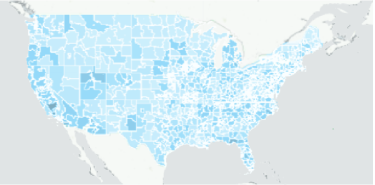
Choropleth - Geographic View
Two zoom levels: state and zip-3, supports population-level insights and regional health trends.
Table - Demographics, Labs, more
Standard breakdowns by key categories for a deeper understanding of each population.
Kaplan-Meier curves - Risk models
Used to analyze outcome risk within filtered groups.
From idea to MVP
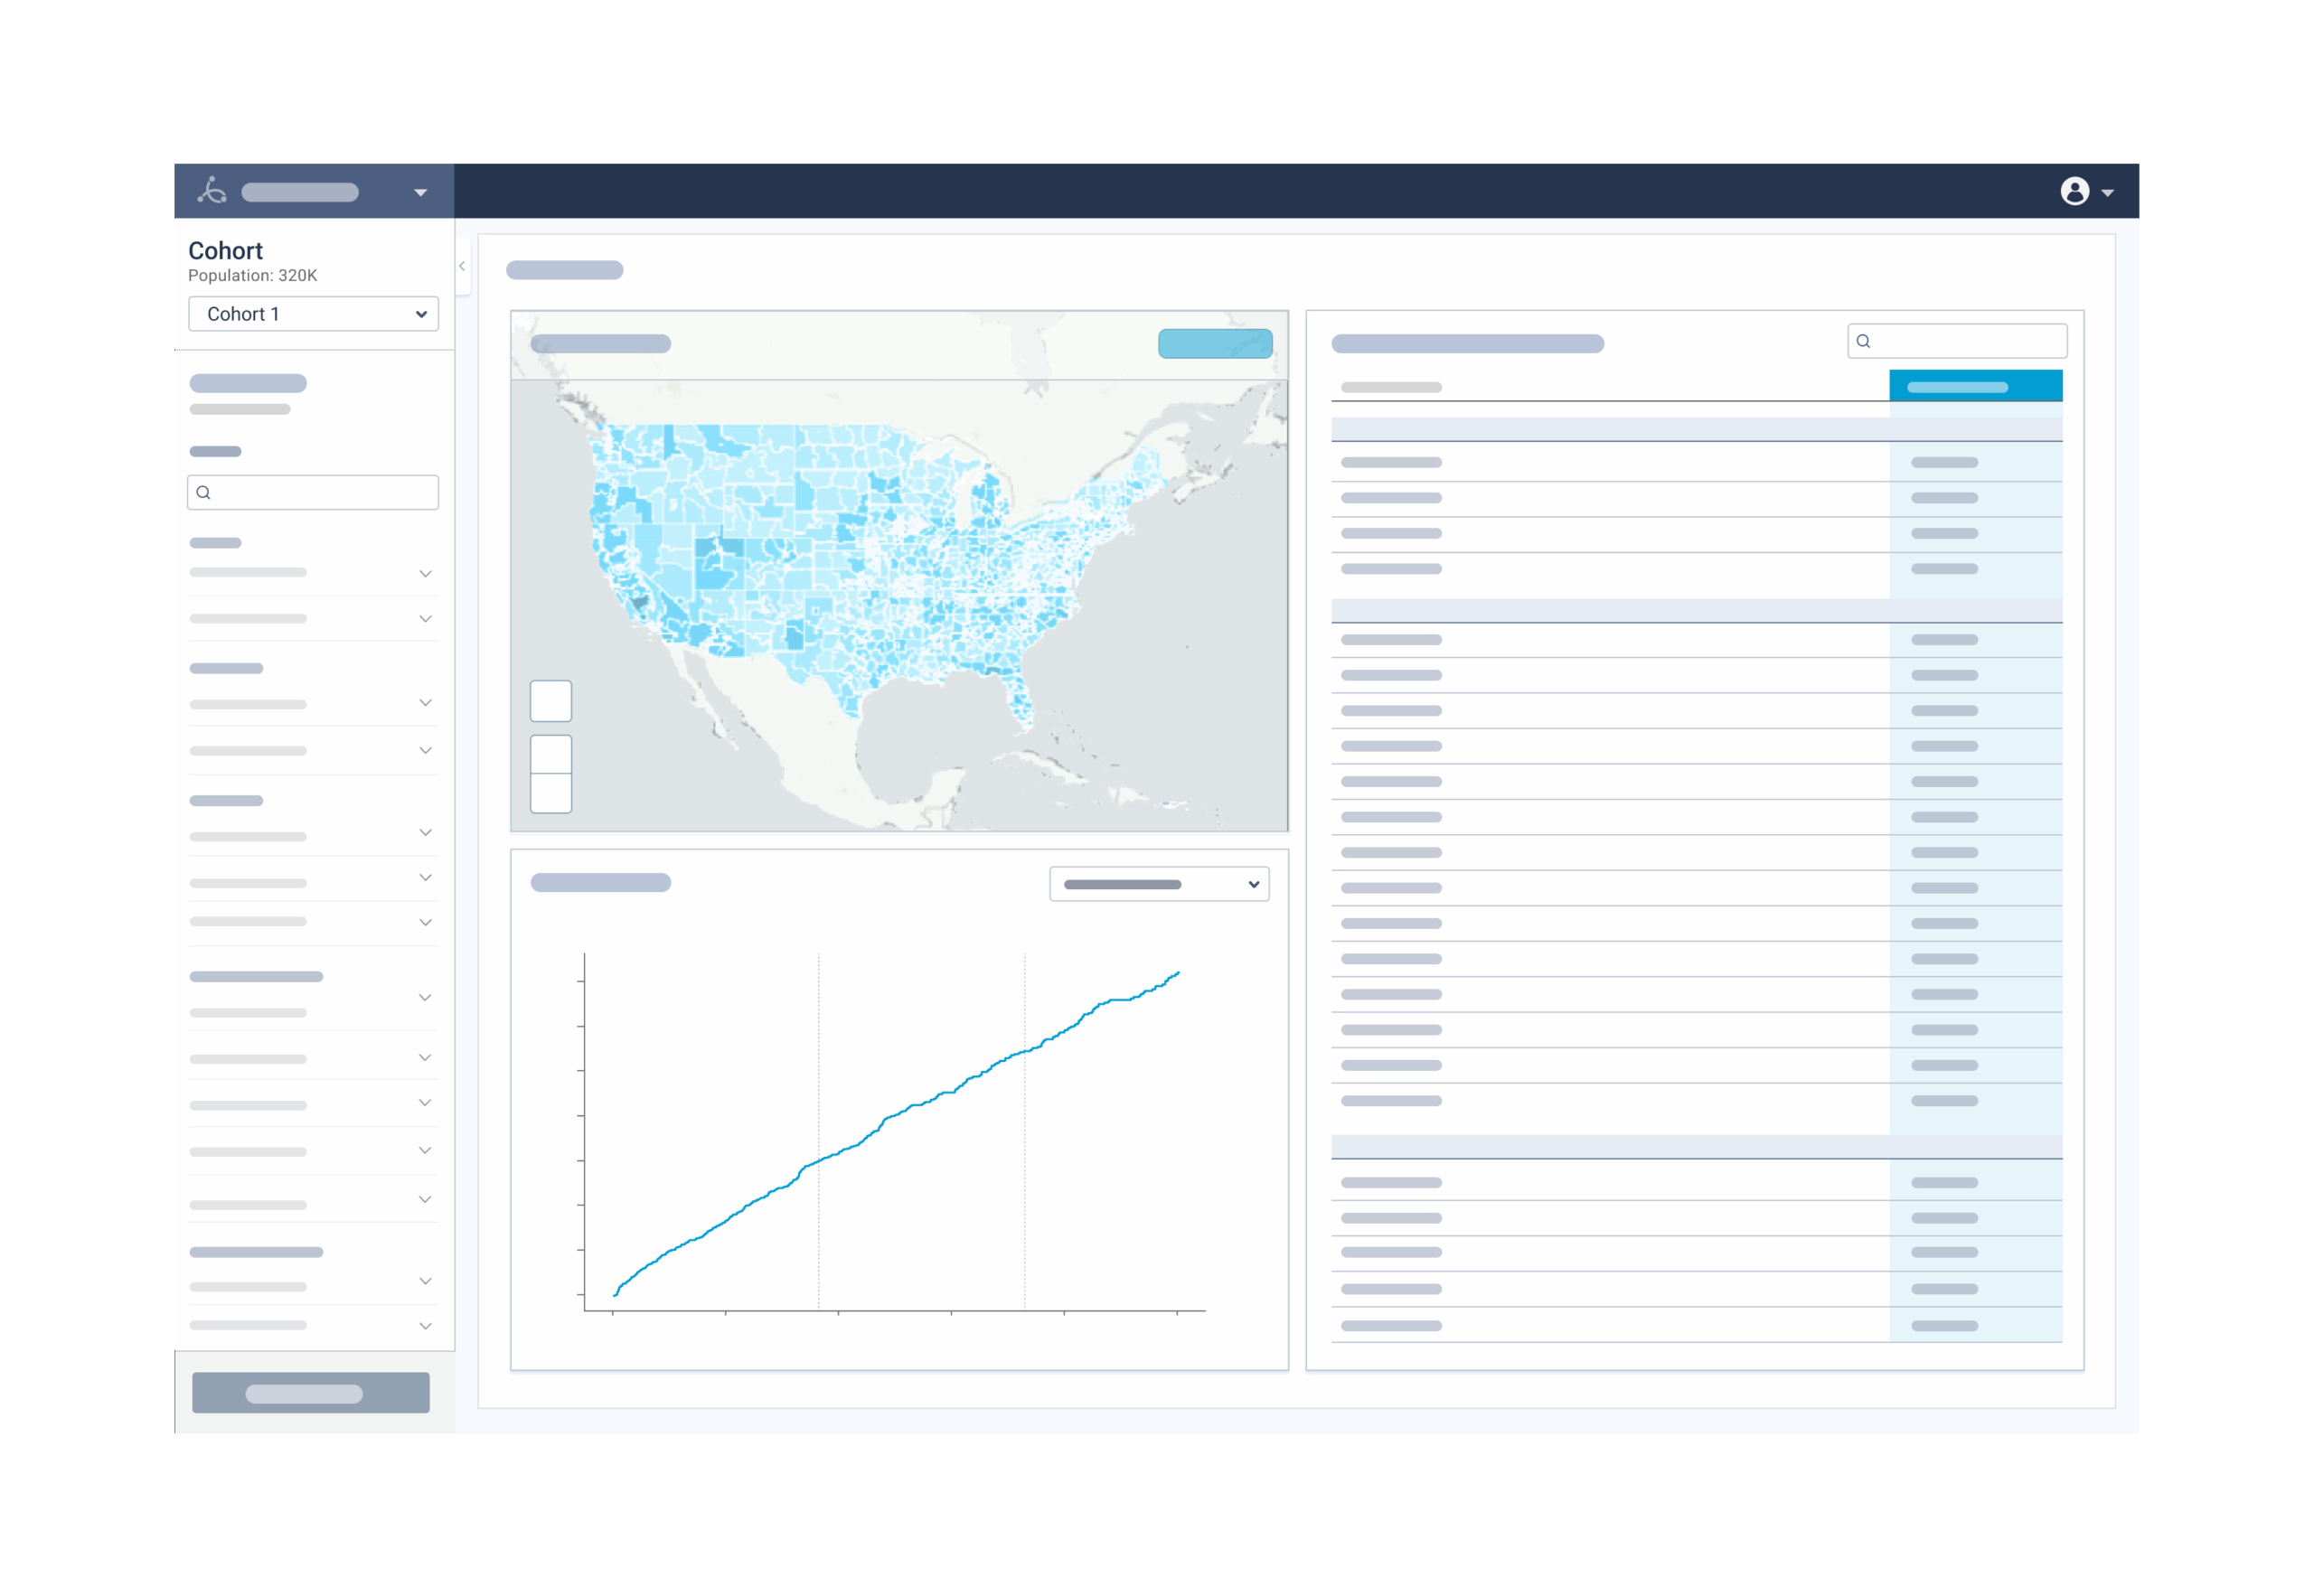
Layout structure
Considering that at this stage the solution we needed was still going to be used for another level of validation and testing, I wanted to keep the interface basic to its core functions to be validated.
The chosen option was focused on minimizing the learning curve by following familiar data dashboard patterns with persistent filters, basic navigation and clear actions. I also designed a starter UI Kit based it’s colors on the company’s branding.
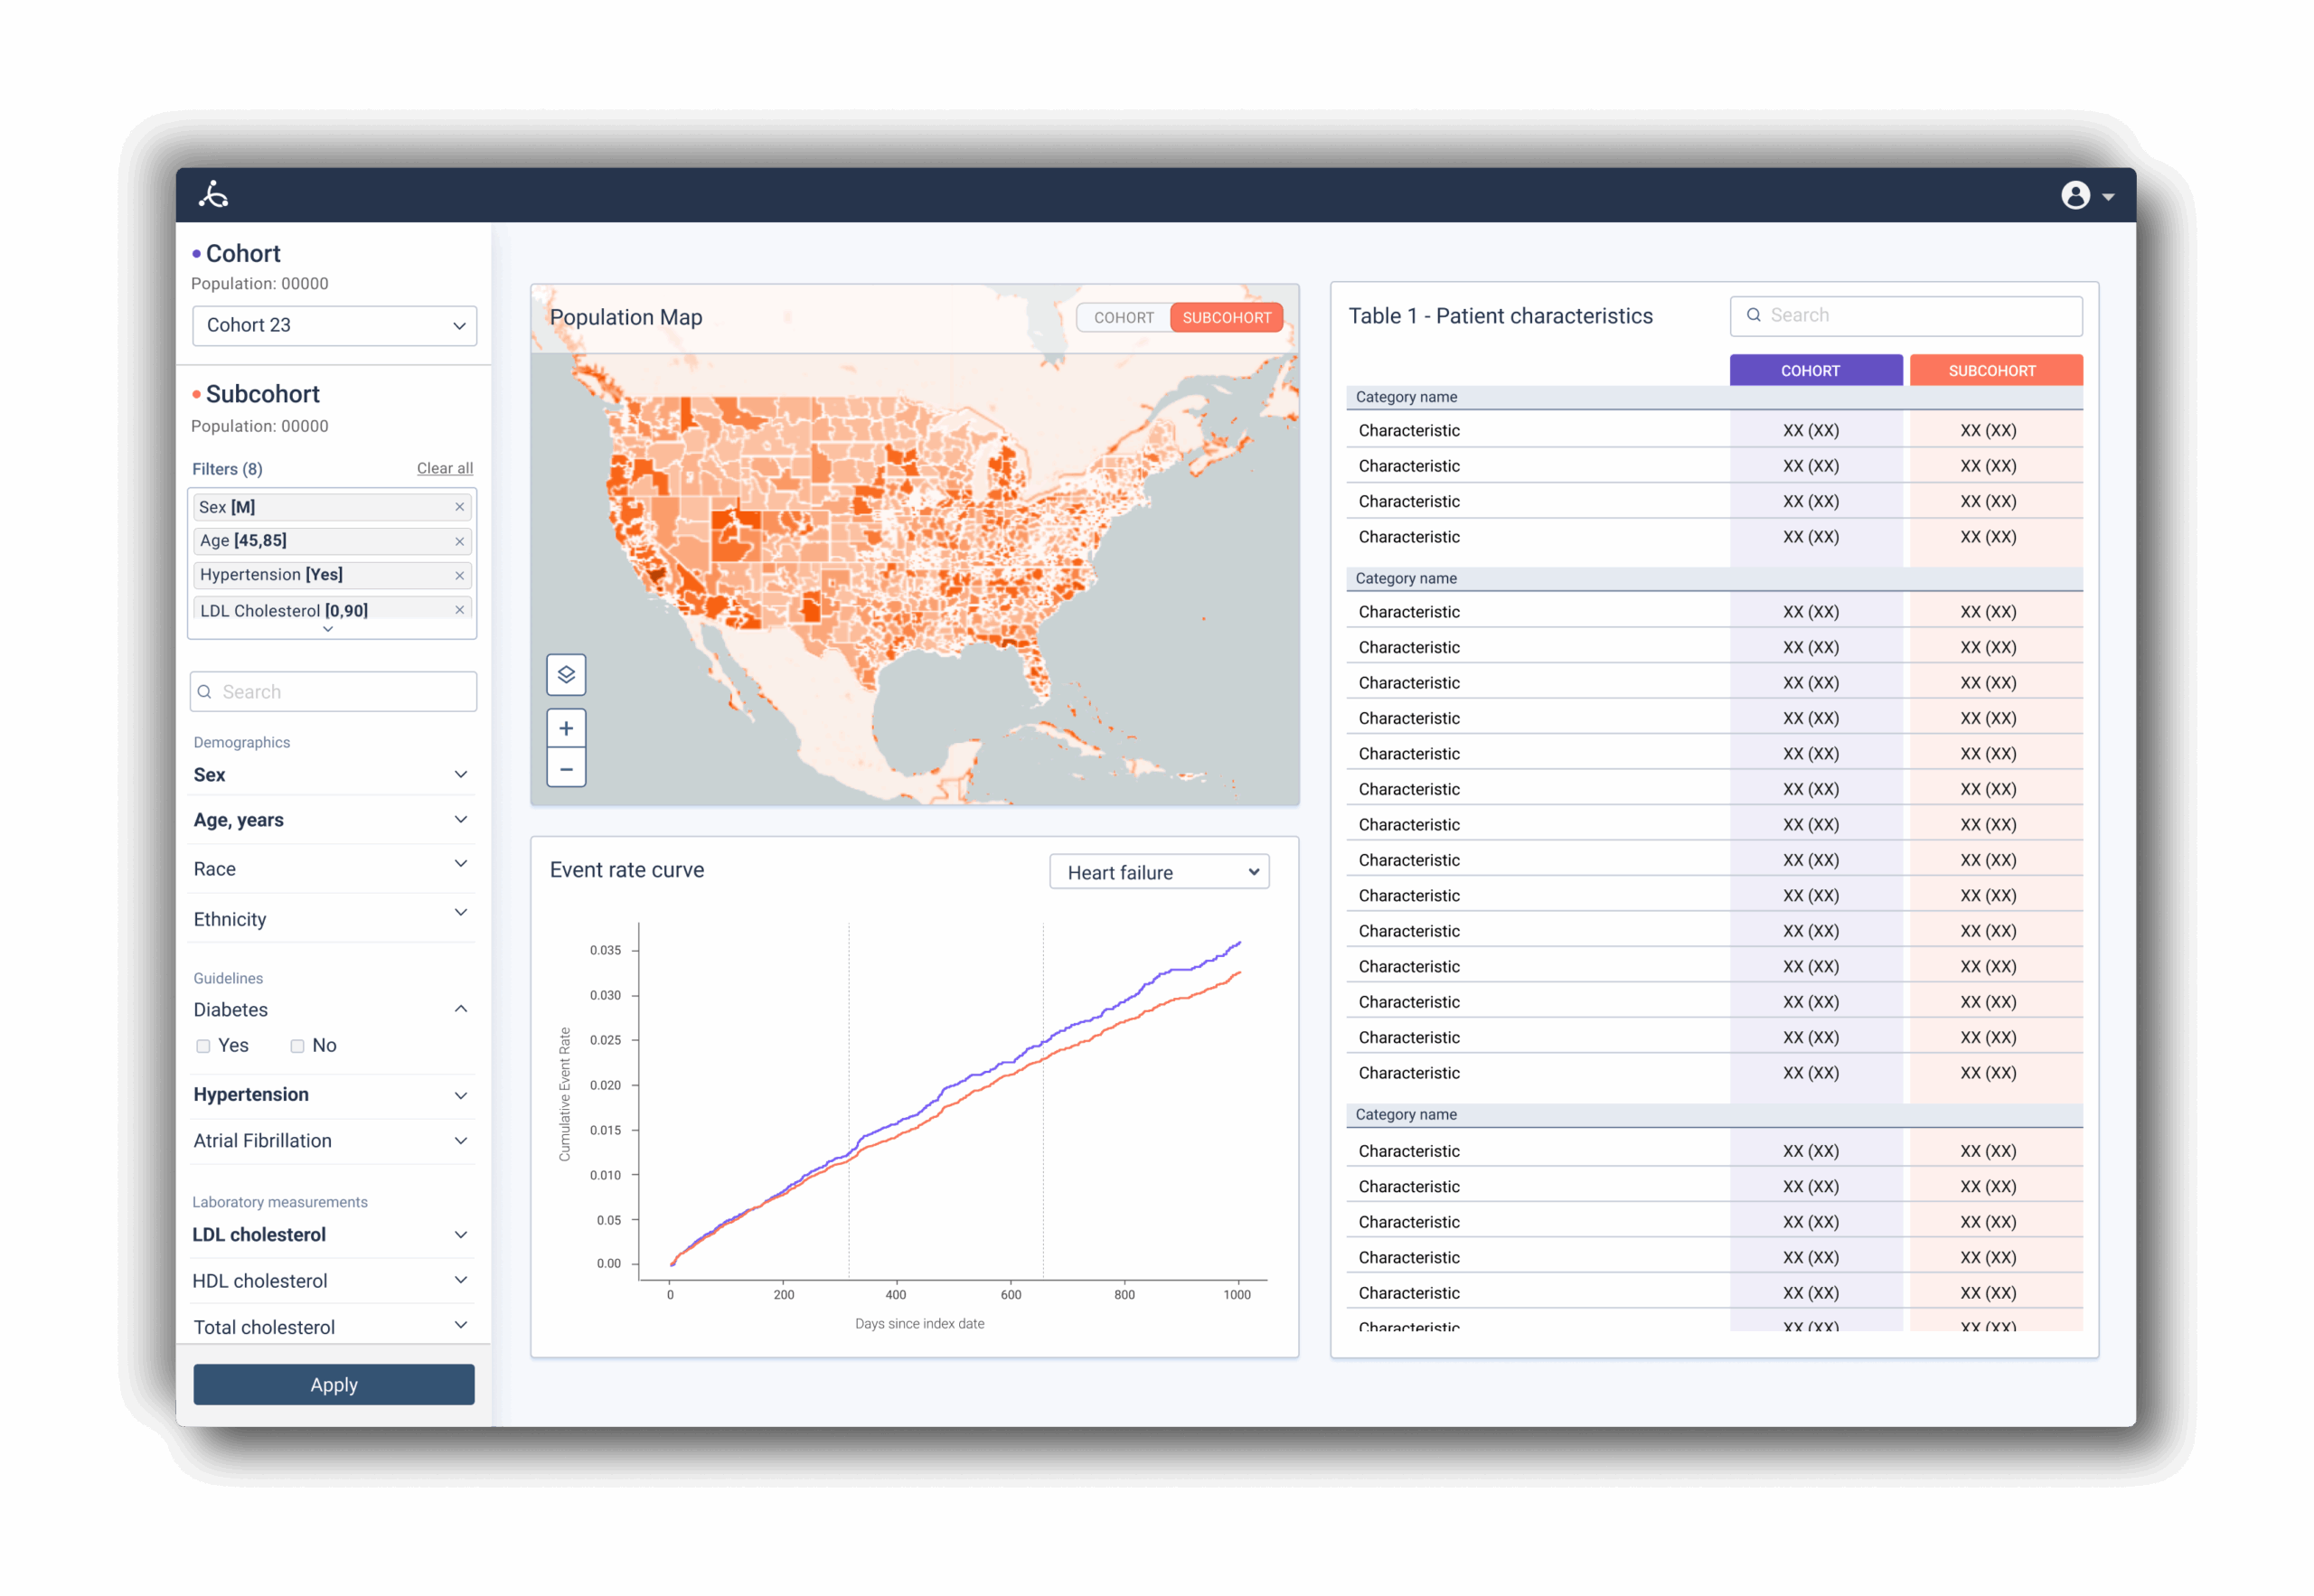
High fidelity prototype
Next we needed a high fidelity prototype to continue the validation of the concept with stakeholders within the industry and to demonstrate value to investors during presentations and events.
The prototype was used in pitch decks, early sales demos, internal and external testing. From this phase we were able to validate the overall structure and data visualizations options and to narrow down more specific user groups:
• Clinical researchers
• Life sciences strategy teams
• Clinical trial planners
• Pharmaceutical MSAs
The MVP
We transitioned the prototype into a functional MVP that was deployed in short-term initiatives within different healthcare industry areas, mainly, clinical and pharmaceutical research.
Key finding from the MVP
Users appreciated the ability to quickly draw high-quality insights from a single platform, replacing workflows that previously involved digging through papers and public datasets. They also identified new needs, exporting and downloading results, detailed graph explanations (especially around statistical methods), ability to save and reuse specific subcohorts
Through in-depth conversations with select users, we learned the product was perceived as clean, intuitive, and significantly more usable than other healthcare data tools.
Subcohort feature redesign
Users could now create, save and compare several subcohorts side-by-side. This required a major UI update. I iterated through multiple layout options, balancing the addition of new functionality with the need to preserve the existing overall structure to avoid significant disruptions for existing users.
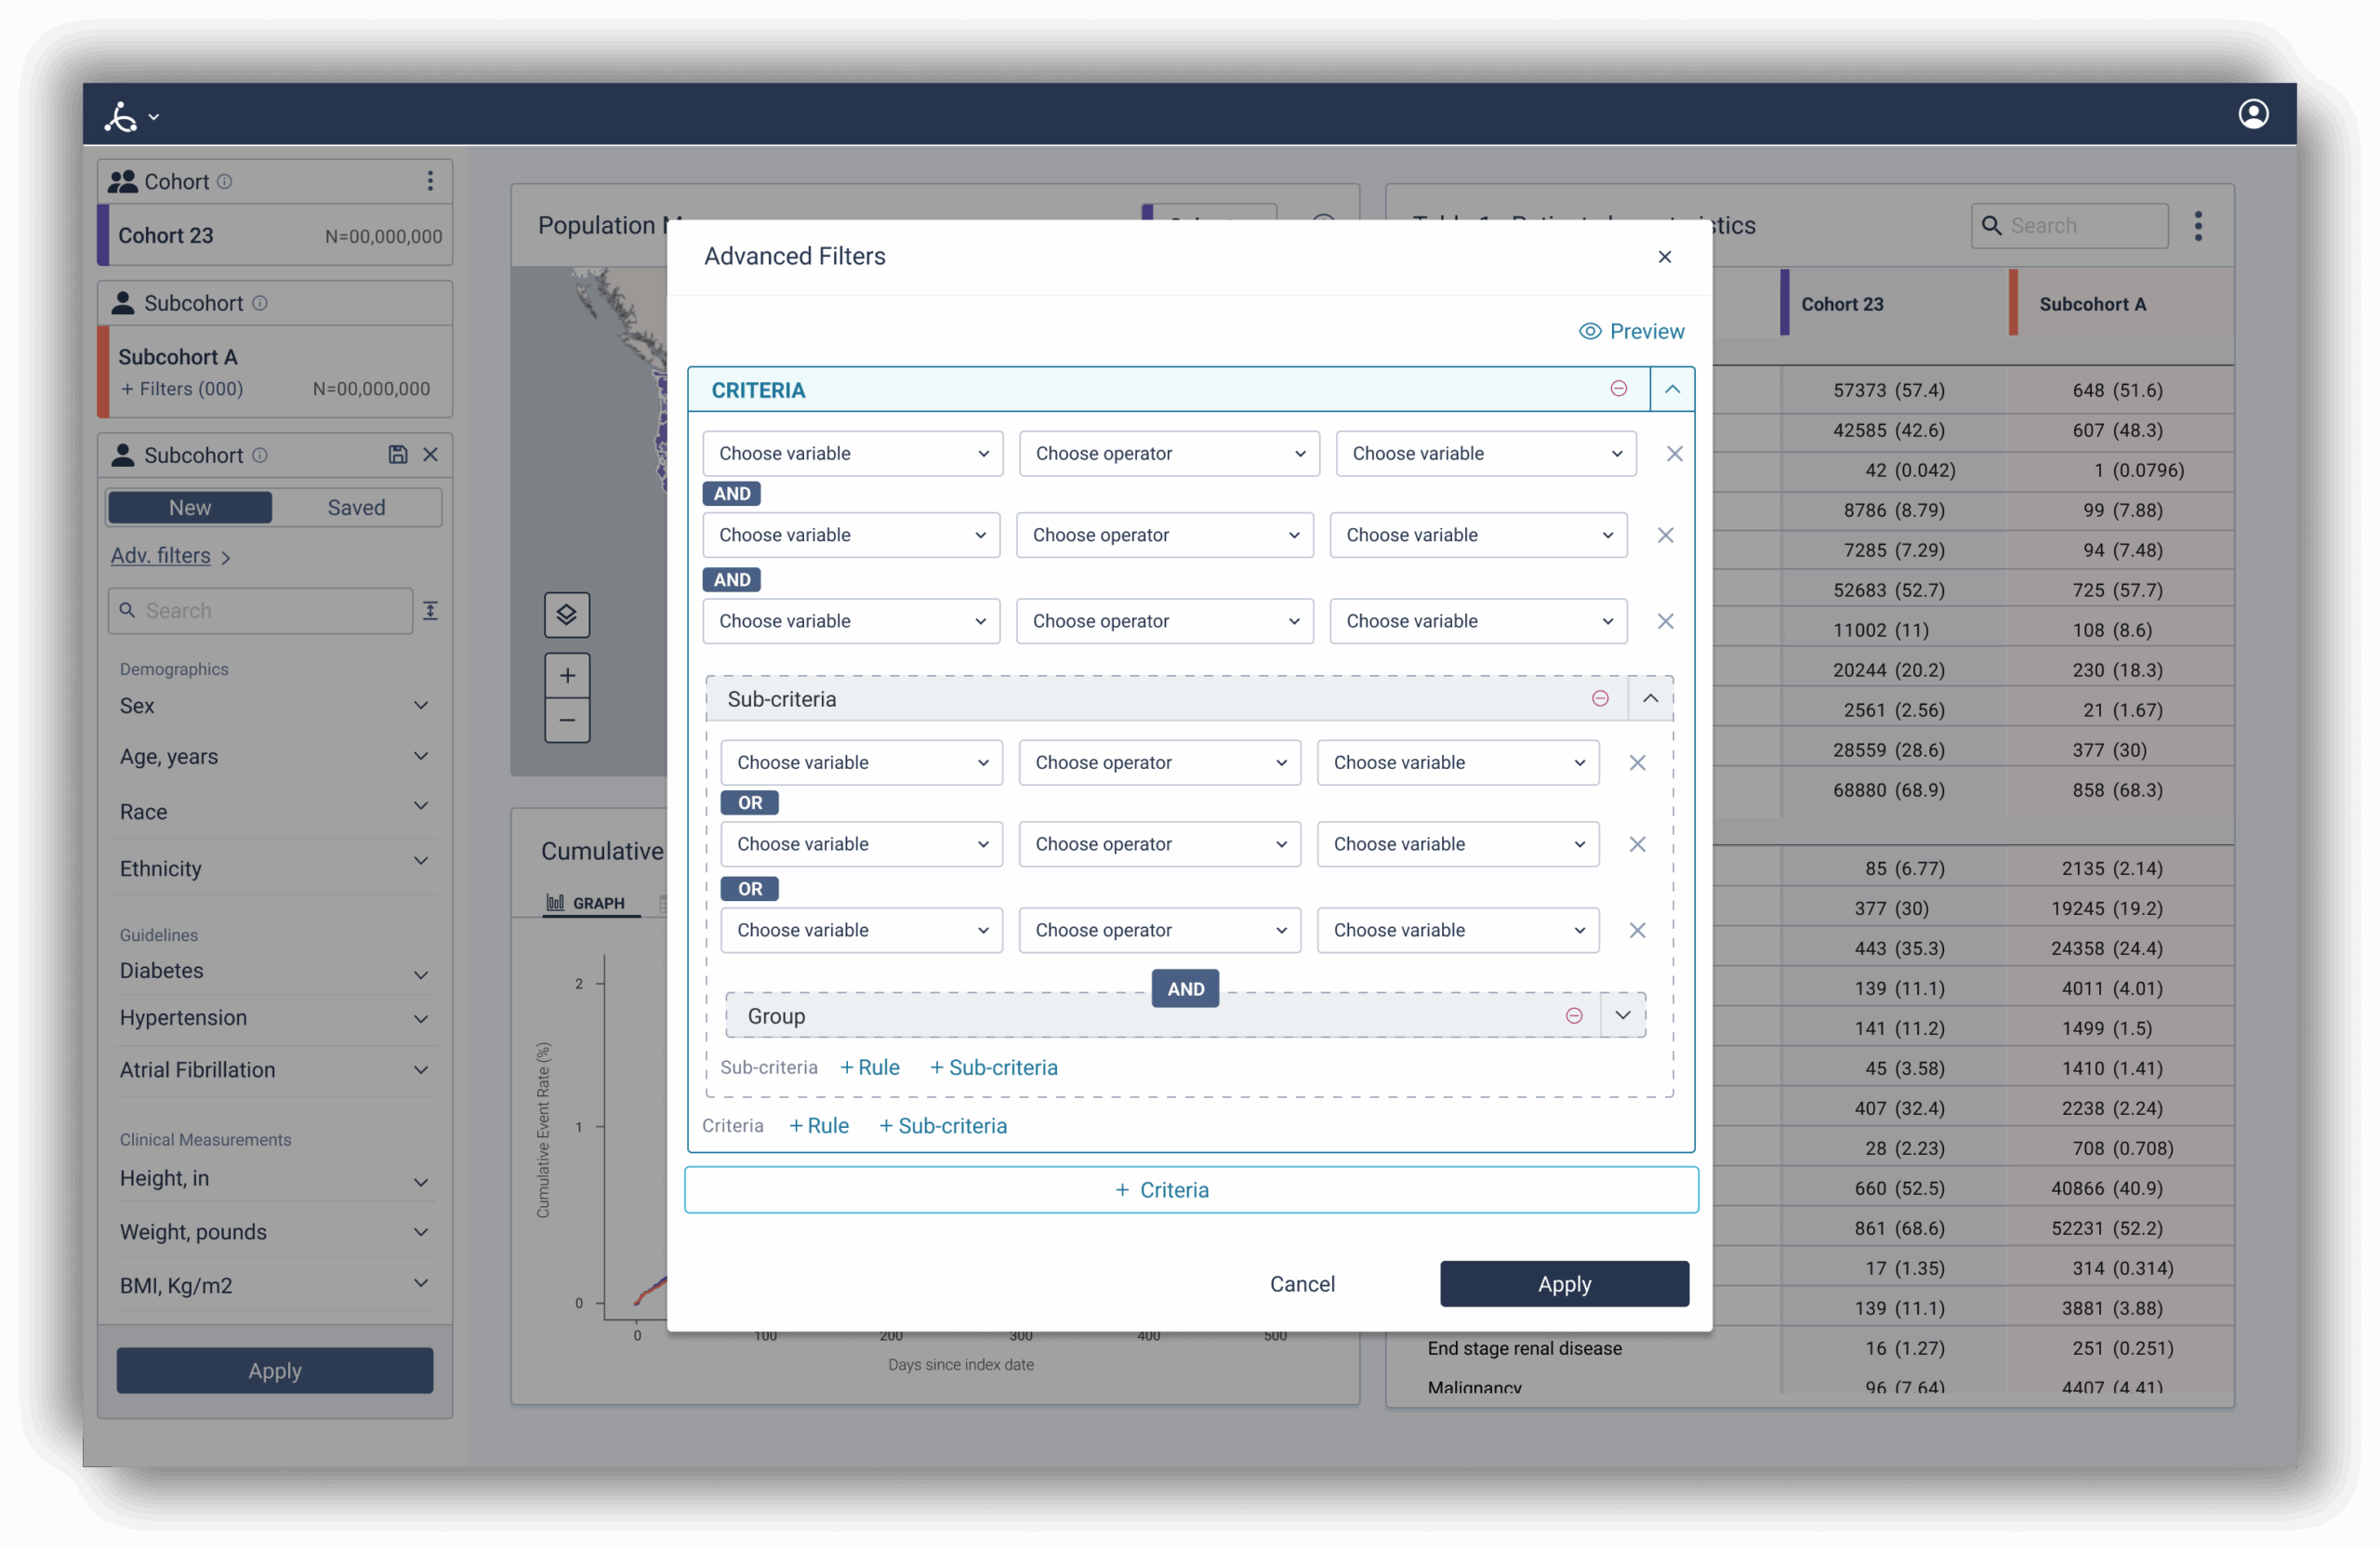
Advanced Query Builder
Introduced to support complex logic when building subcohorts. My focus was on defining logical boundaries, structuring complex filters clearly, and guiding users through creation without overwhelming them.
Identify V1, product highlights
Scaling & Future Vision
As the company grew, the product became part of a broader clinical intelligence platform. During this process I worked on adapting the initial design of the interface using the design system that had been developed, as well as adapting the design structure to follow the other products within the platform.
Generative AI Integration
Working with data science and engineering, we explored structured AI prompts to guide users through subcohort creation. We tested various frameworks internally, for example, chat-based vs. command-based and landed on a structured interaction model.
Impact and reflection
The final version I worked on included major improvements across UI, backend, and frontend. It also launched the beta of the AI-powered subcohort builder.
Although I can’t share specific metrics or initiatives due to confidentiality, the product played a central role in multiple pharma partnerships and research planning efforts, where the main impact identified was related to increased precision for deployment of initiatives, for example, understanding the health of a specific population within a specific area. Decreased time of research phases, avoid complex contracts to access healthcare data with the all in one platform.
Personal reflection
This was one of the most exploratory and collaborative projects I’ve led. With no initial user group or use case, the product evolved through constant iteration and cross-functional input.
I leaned heavily on design fundamentals, clear hierarchy, structured flows, and data visualization best practices, to deliver a product that’s scalable, useful, and easy to use.